
Voronoi Diagram
Interactive WebGL Voronoi diagram. Drag vertices and watch the diagram update in real time.
About Voronoi Diagram
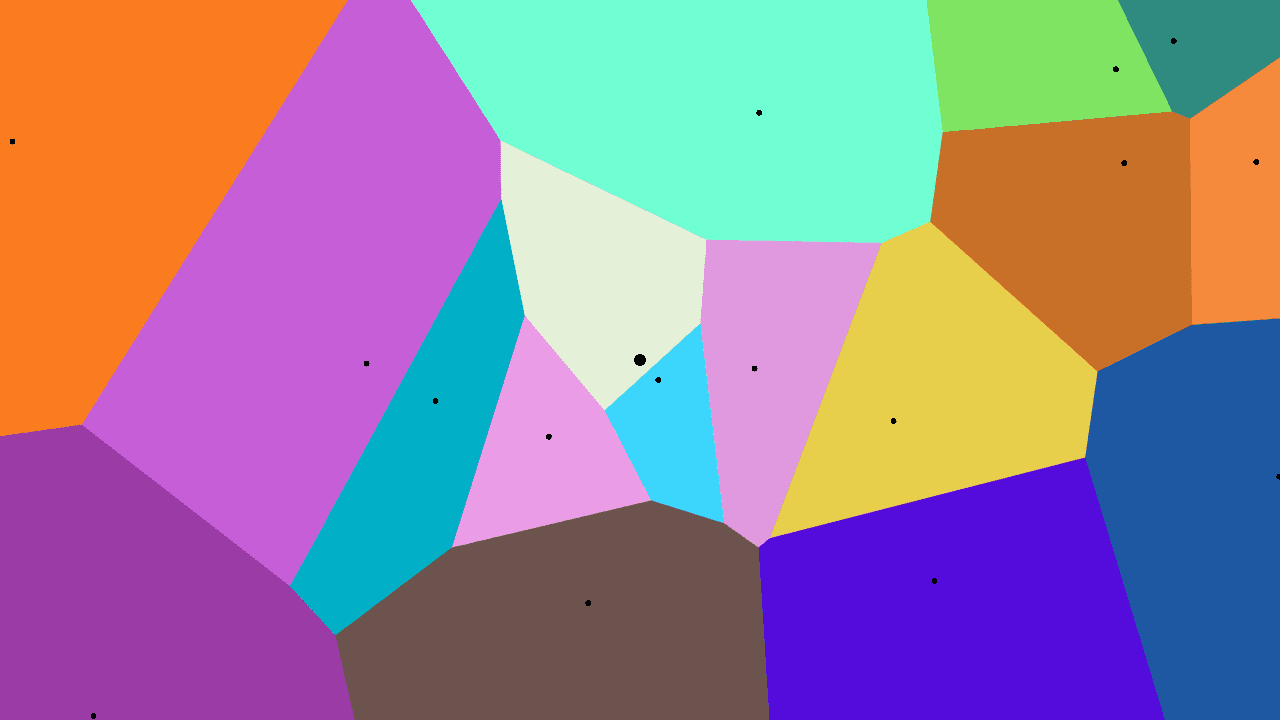
Drag a point across the canvas and watch every cell in the diagram reshape itself instantly. Voronoi Diagram places a set of seed vertices on a WebGL canvas; each vertex owns all the space closer to it than to any other point. Move the seeds, add new ones, or delete them, and the partitioned regions respond in real time — no lag, no redraw button.
It's a clean way to see a concept that shows up everywhere from cell biology to urban planning to game maps. The underlying math is elegant, and this toy makes it tactile. If you enjoy pushing pixels around to watch geometry react, interactive simulations are full of similar playgrounds — including Fluid Simulation, which has the same immediate, mouse-driven feedback with fluid dynamics instead of spatial partitions.
Works best on a desktop with a mouse, where fine dragging gives you the most control over vertex placement.
Look inside
How to use
• Create and manipulate a Voronoi diagram by placing colored points that divide the screen into regions • Left-click anywhere to place a new vertex (seed point) • Left-click and drag existing vertices to move them around in real-time • Right-click on any vertex to remove it from the diagram • Press 'A' to toggle automatic animation of the vertices • Each vertex creates a colored region containing all points closer to it than to any other vertex • Watch how the regions reshape and change colors as you move vertices around • The diagram updates instantly as you interact with it, showing the mathematical relationships between points • Start with a few vertices to see the basic pattern, then add more to create complex divisions
Reviews
No written reviews yet. Be the first!
More from Interactive

An interactive particle sandbox. Drop sand, water, fire, and more and watch elements interact in a mesmerizing physics simulation.
by mohanad-80


